
.png)
.svg)
The Ultimate Guide to Webflow Analytics
Key takeaways
- Tracking website performance is essential after launch. It’s how you understand user behavior, improve UX, and boost conversions.
- Webflow Analytics provides quick, built-in insights like visitor counts, traffic sources, and bounce rates without external setup.
- Google Analytics offers deeper behavioral data, goal tracking, and long-term reporting for advanced marketing and SEO analysis.
- Google Tag Manager centralizes multiple tracking codes, making analytics management easier and cleaner.
- Google Search Console complements your stack by monitoring visibility, indexing, and keyword performance.
- Using these tools together gives you both high-level and granular insights, helping your site grow smarter over time.
Upgrading your business doesn’t stop at launching a website, especially if you operate online. Once your site is live, it’s critical to measure how real visitors are interacting with it. This data helps you make smarter decisions, improve UX, and ultimately drive more conversions.
If your website is built on Webflow, you now have multiple ways to track performance. The traditional setup includes tools like Google Analytics and Google Tag Manager. These provide in-depth reports and granular control over user behavior tracking.
But recently, Webflow introduced its own native analytics dashboard, a built-in solution that offers quick visibility into your site’s performance, without external integrations.
In this updated guide, we’ll walk you through:
- What Webflow Analytics is and how it compares to tools like Google Analytics
- How to set up analytics using Webflow, Google Analytics, and Google Tag Manager
- Tips for tracking conversions, events, eCommerce metrics, and site search
Whether you’re using one or multiple tools, this guide will help you choose the right stack for your goals, and get everything set up the right way.
{{cta}}
What Is Webflow Analytics?
Webflow Analytics is a native analytics tool available directly within your Webflow Designer and Site Settings. It provides a streamlined view of core visitor data, without needing to configure third-party tools.

Key data points available include:
- Total visitors and sessions
- Page views
- Bounce rate
- Top traffic sources
- Device breakdown
- Geographic data
This feature is especially useful for quick, high-level performance checks without leaving the Webflow platform.
Webflow Analytics vs. Google Analytics: Pros and Differences
Both platforms can help you understand your website performance, but they serve different purposes. Here’s how they compare:
Webflow Analytics – Pros
- Built directly into Webflow (no integration required)
- Real-time visitor data and traffic sources
- Clean, visual dashboard for quick insights
- No setup needed: enabled automatically on hosted sites
- Perfect for non-technical users or quick reporting
Google Analytics – Pros
- Much more granular data (sessions, users, cohorts, funnels, events)
- Fully customizable reporting and dashboards
- Supports advanced conversion tracking and goals
- Integrates with Google Ads, Search Console, and other platforms
- Long-term trend analysis and data exports
Key Differences
- Depth vs simplicity: Google Analytics offers deeper data; Webflow Analytics is faster to access.
- Customization: Google lets you track custom events and define goals; Webflow has a fixed metrics set.
- Ease of setup: Webflow requires no setup; Google needs manual integration via Measurement ID or GTM.
- Data ownership: Google stores and processes data externally; Webflow keeps it within your hosting dashboard.
- Use cases: Webflow is ideal for lightweight, visual tracking. Google Analytics is better for marketing funnels, advertising ROI, and detailed segmentation.
How to Set Up Webflow Analytics
Webflow Analytics is automatically activated when you host your site on a Webflow plan. To access your site data:
- Go to your Webflow Dashboard
- Open your project and navigate to Site Settings
- Click on the Analytics tab
- Review core data like sessions, page views, bounce rate, devices, and top pages
Note: Webflow Analytics is only available for hosted projects with a paid Site Plan.
No code, no scripts, and no third-party integrations are needed. It’s designed to “just work.”
Setting up Google Analytics in Webflow
Here are the reasons why I recommend Google Analytics, in a bulleted list:
- Set up conversion goals: Google Analytics allows you to track specific actions that visitors take on your website, such as signing up for a newsletter or making a purchase. This information can help you to understand what is working well on your website and what needs to be improved.
- Set events: Google Analytics also allows you to track events on your website, such as clicking on a button or watching a video. This information can help you to understand how visitors are interacting with your website and what content they are most interested in.
- Great user behavior insights: Google Analytics provides a wide range of insights into user behavior, such as where visitors are coming from, how long they are staying on your website, and what pages they are visiting. This information can help you to improve the user experience of your website.
- Great visual reports: Google Analytics provides a variety of visual reports that make it easy to understand your website's data.
Here are some additional benefits of using Google Analytics:
- It is free to use.
- It is integrated with other Google products, such as Google Ads and Google Search Console.
- It is widely used by businesses of all sizes.
- It is constantly being updated with new features and improvements.
How you can set it up in your Webflow project.
- Go to your Dashboard and click Project Settings → Integrations.
- Click on Google Analytics admin page.
Getting Your Google Analytics Tracking ID
Next, you’ll need to have a tracking ID for your Google Analytics so that you can enter in Webflow and start tracking your visitors. Once you click on the Google Analytics admin page link, you’ll have to connect your Google account with analytics.
To sign up for analytics, you’ll have to enter the following information:
- Whether you need to use it for a website or mobile app (in this case, you should choose Website)
- Account name
- Website name
- Website URL
- Industry
- Reporting Time Zone
Add Your Tracking ID in the Project Settings
Once you’ve set up the Google Analytics account, you’ll receive a tracking ID that you just need to copy and paste in the designated field in Webflow. Here’s a short step-by-step explanation.
- Copy the tracking ID.aa
- Paste it in the field under Google Universal Analytics ID on the Integrations page in Webflow.
- Click on Save Changes.
- Publish the changes.
That’s pretty much it. Google Analytics will need some time to start tracking data — usually one day. After that, you can select any custom date and get valuable insights about visitors on your Webflow-made website.
Setting up Google Tag Manager in Webflow
Google offers a service that can help you improve your analytics even more by consolidating various pixels, codes, and script tags into easily manageable tags. This will further improve your website analytics integrations.
First of all, you have to sign up for a Tag Manager on this page.
- Click Create account
- Add account name
- Select a country
- Set up a container. Select Web if it’s for your website and enter its address in the designated field.
- Press Create
Integrating Google Tag Manager with Google Analytics in Webflow
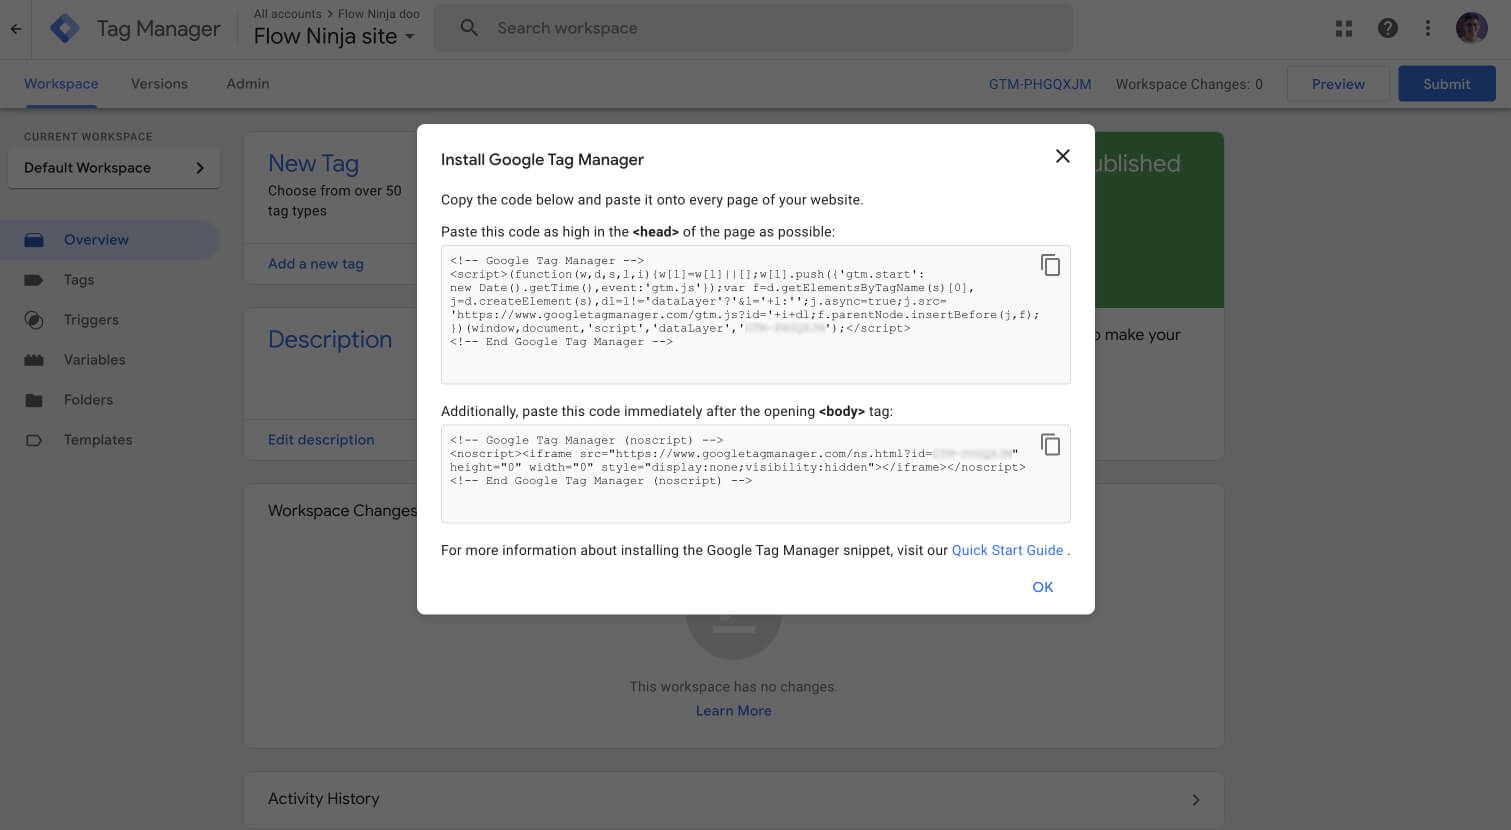
Once you open an account, you’ll have to integrate your Google Tag Manager in Webflow. You’ll see two code snippets, so here’s how to use them to complete this process.
- Copy the first snippet to your clipboard.
- Go to your Webflow projects and click on Project Settings.
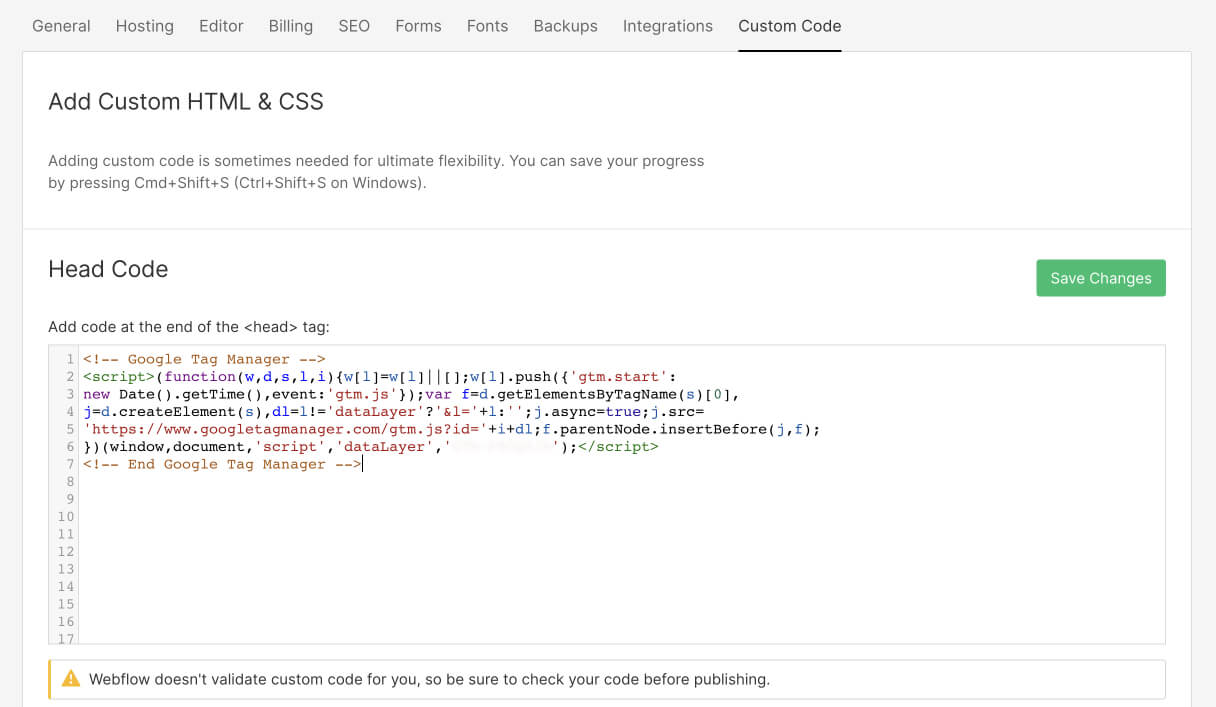
- Head over to the Custom Code tab.
- Paste the first snippet.
- Save changes.
There’s the short snippet that you’re also required to enter to integrate Google Tag Manager fully. Please note that the steps below might not be required in many cases as the second snippet is only necessary when JavaScript is turned off in your web browser, so we usually don't add the second script for our Webflow sites. JS is turned on by default, but if you disabled it for whatever reason, you’ll need to do the following thing.
- Go back to the Designer.
- Click on the Add panel and drag Embed into your project. Make sure that Embed is the first option under Body.
- Go back to Tag Manager and copy the second snippet.
- Return to Webflow and paste the snippet.
- Click Save & Close
If you use Webflow, you can easily paste the Embed element on all the pages where you wish to integrate Google Tag Manager.
If you’re going to embed custom code on many pages, it’s a good idea to use the Embed code in a symbol. Using that approach, when you add a symbol from one page on all other pages, you'll save plenty of time if you need to edit the code later. Webflow will affect all instances of one symbol if you change anything in one instance only.
Furthermore, for agencies looking to streamline their marketing reporting, ready-made agency templates offer a quick and efficient way to present data and insights. These templates are designed specifically for marketing analytics, enabling you to visually represent your Webflow-generated data in an easy-to-understand format.
How to Set Up Views in Google Analytics
To set up views in Google Analytics, follow the steps below:
- Sign in to your Google Analytics account.
- Click Admin.
- In the ACCOUNT column, click the account to which you want to add the view.
- In the PROPERTY column, click the property to which you want to add the view.
- In the VIEW column, click Create view.
- Enter a Name for the view.
- Select the View Type.
- Click Create view.
You can create up to 25 views per property. Each view can have its own unique settings, such as filters, goals, and segments. This allows you to create different views for different purposes, such as tracking different marketing campaigns or analyzing different segments of your audience.
Here are some tips for setting up views in Google Analytics:
- Give each view a descriptive name so that you can easily identify it later.
- Choose a View Type that is appropriate for your needs. The most common View Type is Website.
- Consider using filters to exclude unwanted data from your views. For example, you might want to create a filter to exclude internal traffic from your website.
- Set up goals to track specific actions that you want visitors to take on your website, such as signing up for a newsletter or making a purchase.
- Create segments to group visitors together based on shared characteristics, such as interests, demographics, or behavior.
How to Set Up Event Tracking in Google Analytics
Google Analytics allows you to track events, which are the actions that users take on your website. This can be anything from clicking a button to watching a video to making a purchase. By tracking events, you can learn more about how users are interacting with your website and what they are interested in.
To track events in Google Analytics, take a look at the following steps:
- Open Google Analytics.
- Go to Behavior > Events > All Events.
- Click Create Event.
- Click Create.
- Enter an event name. The event name should be descriptive and easy to understand.
- Set up conditions for your event. This will determine which user actions trigger the event. For example, you might set up a condition for an event that triggers when a user clicks on a specific button or watches a video for more than 30 seconds.
- Configure the parameters (optional). Parameters allow you to collect additional data about the event, such as the product name that was purchased or the video title that was watched.
- Click Create.
Once you have created an event, you can create a conversion goal to track the event in your Google Analytics reports. To do this, you should:
- Go to Conversions > Goals.
- Click New Conversion Event.
- Type in the name of the event you’ve just created.
- Click Create.
Now, you will be able to track the event in your Google Analytics reports. You can see how many times the event has been triggered, as well as other metrics such as the conversion rate and the bounce rate
Integrate Site Search with Google Analytics
Webflow’s site search feature lets visitors quickly find the desired content on your site. That’s why the site search is a great source of information about your visitor’s behavior and needs. To track how visitors use the search option and what they’re searching for, you need to integrate site search with Google Analytics.
Here’s how to do it.
- Log in to your Google Analytics account.
- Select Admin and go to the view in which you want to set your Site Search up.
- Click View Settings and turn on Site Search Tracking.
- Fill in the Query Parameter field with internal query parameters. The two most important ones are search and query (enter them as search,query).
If you want to learn more about setting up the site search feature, I suggest reading the detailed guide by Google.
Setting Up Google Search Console with Webflow

Google Search Console (GSC) is a free tool from Google that helps you monitor and improve your site’s visibility in search results. It shows how your site performs in Google Search, what keywords people use to find it, and alerts you about technical issues that might affect indexing or SEO.
With GSC, you can:
- Track keyword impressions, clicks, and average positions
- Submit your sitemap for faster indexing
- Identify crawl errors and broken links
- Monitor Core Web Vitals and mobile usability
- Check which pages are indexed by Google
How to Connect Google Search Console to Webflow
- Go to Google Search Console and sign in with your Google account
- Click “Add property” and choose the URL prefix option
- Enter your full Webflow domain, including https:// (e.g. https://www.yoursite.com)
- Verify ownership by choosing the HTML tag method
- Copy the provided meta tag from GSC
- In Webflow:
- Go to your project → Project Settings → Custom Code
- Paste the meta tag inside the tag section
- Click Save Changes and Publish your site
- Go back to GSC and click “Verify”
Once verified, you’ll start seeing search data in a few days. Don’t forget to also submit your sitemap (https://www.yoursite.com/sitemap.xml) in the “Sitemaps” section of GSC for better indexing.
{{cta}}
Final Thoughts
Tracking performance is no longer optional: it’s essential. Whether you’re using Webflow’s native analytics, Google Analytics, Tag Manager, or Search Console, having visibility into how users interact with your website allows you to make smarter decisions, refine your content, and improve conversions.
Each tool has its strengths:
- Webflow Analytics offers a quick, no-setup solution for surface-level insights.
- Google Analytics provides deeper behavioral data and long-term trend analysis.
- Google Tag Manager simplifies complex tracking setups without cluttering your site’s code.
- Google Search Console ensures your site is visible and healthy in Google Search.
Used together, these tools can form a robust analytics stack tailored to your goals, whether you’re optimizing for SEO, running ad campaigns, or fine-tuning UX.
The sooner you start tracking, the sooner you can grow smarter.
Set up your tools, connect the data, and let your website start working harder for your business.
FAQ for Webflow Analytics
How do you connect Google Analytics to a Webflow project?
You can connect Google Analytics to a Webflow project by adding your tracking ID in the Project Settings under the Integrations tab. Alternatively, you can manually insert the tracking script in the site’s custom code section to ensure proper analytics tracking.
What’s the difference between Webflow Analytics and Google Analytics?
Webflow Analytics provides basic site metrics such as traffic and form submissions, while Google Analytics offers advanced segmentation, user behavior tracking, and conversion goals. For deeper insights and marketing attribution, Google Analytics is typically the preferred tool.
Can you use Google Tag Manager with Webflow to track advanced events?
Yes, you can integrate Google Tag Manager with Webflow by embedding the GTM container code in the project’s custom code section. This enables tracking of advanced user events, conversions, and marketing pixels without needing to edit site code repeatedly.

Uros Mikic
Since 2015, Uros has mastered Webflow, developing everything from full games to enterprise solutions. His expertise led to the creation of Flow Ninja, aimed at using Webflow to help clients scale their businesses and accelerate growth.


.webp)


.svg)

.png)
.png)
.webp)
.svg)

